Wine Quality Data
I employ a Random Forest Regressor to analyze the factors influencing wine quality ratings.
According to Kaggle’s dataset description, this dataset is related to red variants of the Portuguese "Vinho Verde" wine. The dataset contains 11 input variables (fixed acidity, volatile acidity, citric acid, residual sugar, chlorides, free sulfur dioxide, total sulfur dioxide, density, pH, sulphates, and alcohol) and we’ll use these variables to see how they impact the output variable (quality).
I used Kaggle’s Wine Quality Dataset found here.
I used SHAP values to interpret and explain the model. You can read more about the SHAP values here.
First, I load the necessary libraries for examining the data
I see if there are any missing values and rename column names for better recall
Note that the minimum value from the quality column (cut off in the screenshot) is 3 and the maximum value is 9. The mean is 5.877
I load Scikit-learn (Sklearn) machine learning library.
I set the target variable and split the data into train and test data.
Here, I use scikit-learn's Random Forest Regressor. A random forest is a meta estimator that fits a number of decision tree regressors on various sub-samples of the dataset and uses averaging to improve the predictive accuracy and control over-fitting. You can read more about scikit-learn’s random forest regressor here.
After generating the model, I examine the SHAP values. SHAP values, or SHapley Additive exPlanations, are a way to explain the output of a machine learning model by assigning importance values to each feature. SHAP values can explain how each feature affects a prediction, how it interacts with other features, and its significance compared to other features.
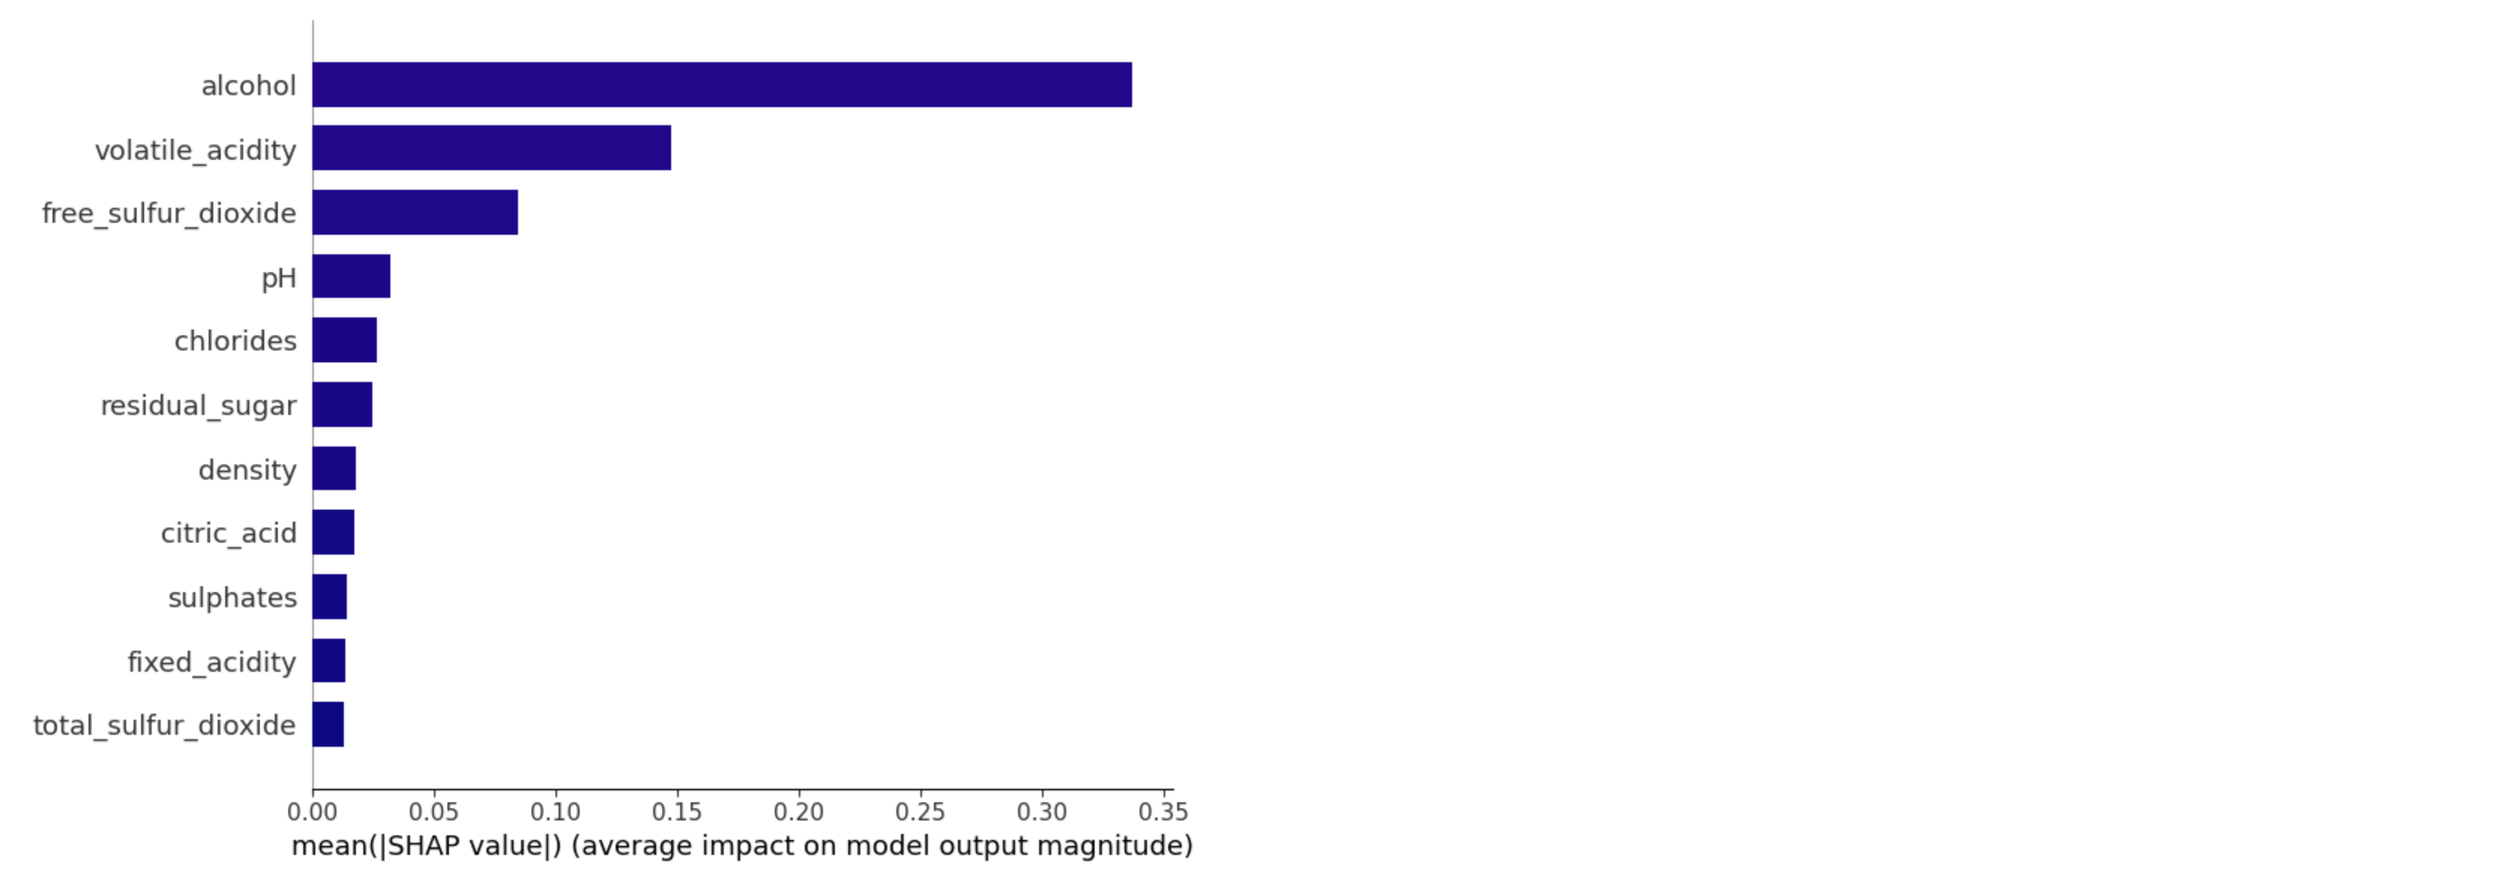
The image below shows the mean absolute SHAP value that illustrate the global feature importance. The SHAP global feature interaction analysis shows how different features interact with each other to influence a model’s predictions across the entire dataset.
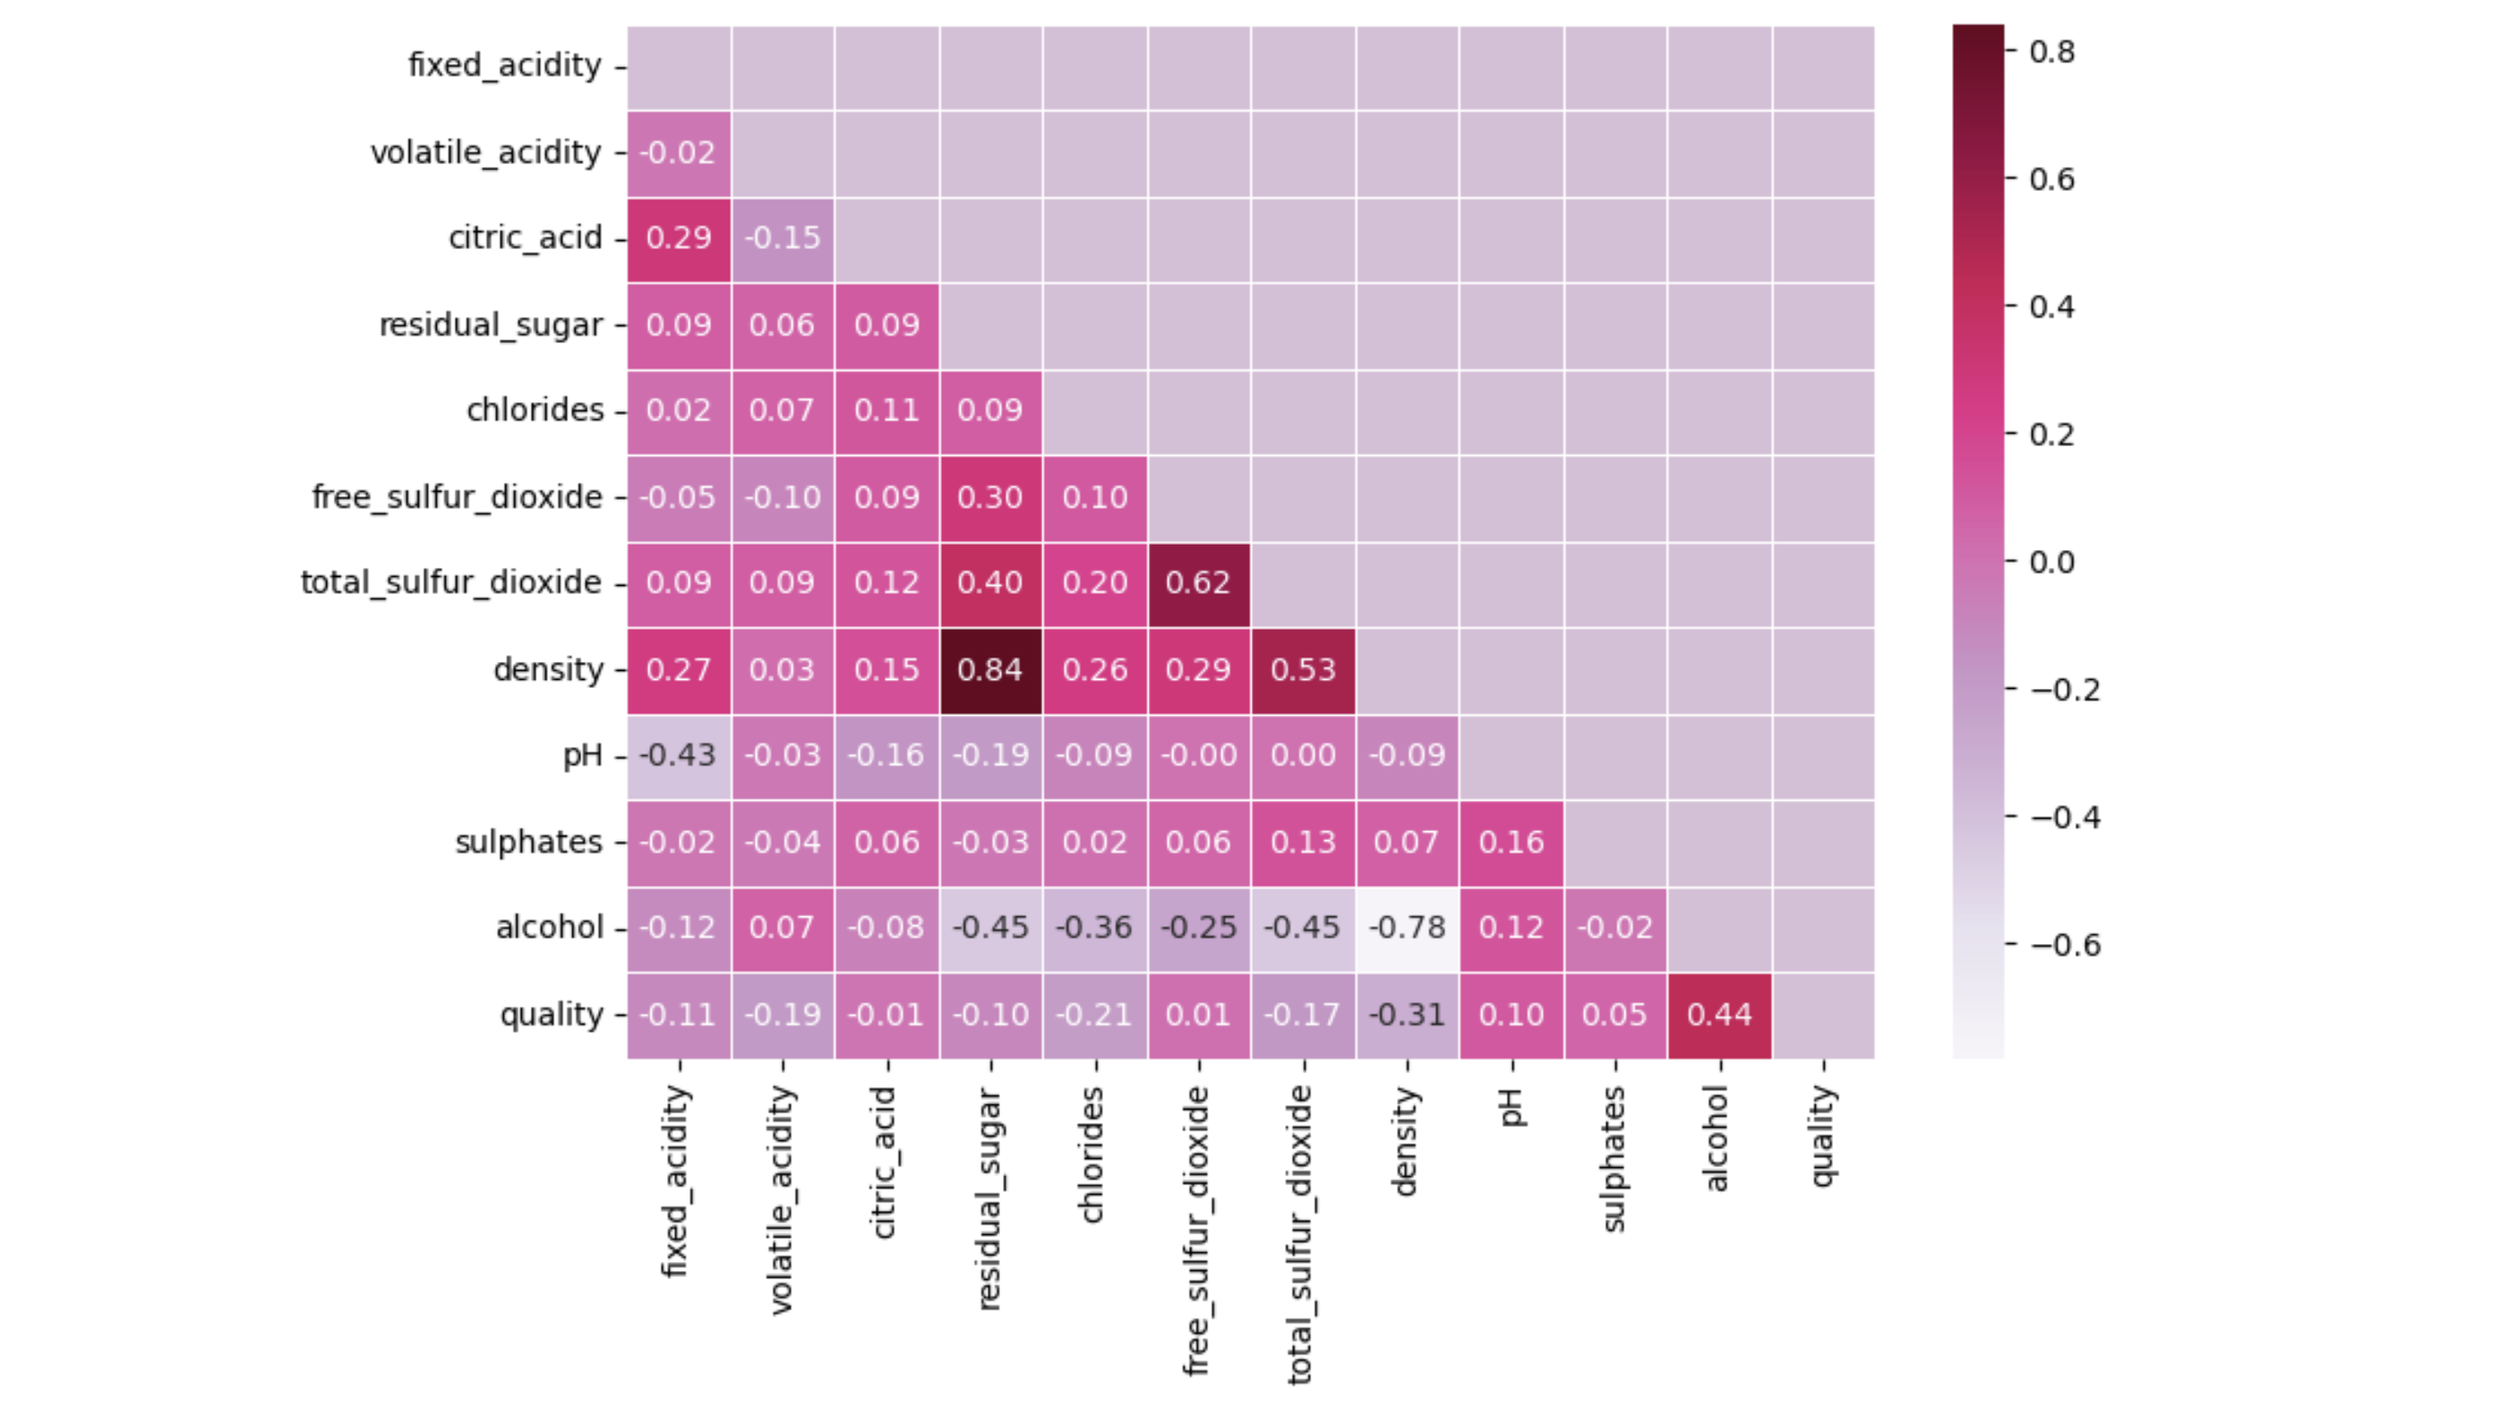
The image below shows a heatmap that visualizes the correlation matrix. Darker shades indicate stronger correlation, whereas lighter shades indicate weaker correlation between two features.
The image below shows a summary plot that depicts each feature’s impact on model output. It shows both the feature importance and feature effects. In the summary plot, features are displayed according to their importance. The blue color indicates lower feature values and the red color indicates high feature value. Here, we can see that alcohol has a positive relationship with the target (‘quality), where volatile_acidity has a negative relationship with the target.
Next, I look at SHAP dependence plot for ‘citric_acid’, ‘residual_sugar’, and ‘alcohol’. This function automatically includes another variable that your chosen variable interacts most with.
I examine individual observations from the model. I randomly pick a few data points and visualize them with SHAP force plots. SHAP force plots help interpret individual predictions by the model. SHAP force plots show the cumulative effect of all features within that observations and which features are increasing or decreasing the prediction.
Takeaways
Positive Correlation:
Alcohol and Quality (did we already know this?): there is a relatively strong positive correlation (0.44) between alcohol content and wine quality.
Density and Residual Sugar: a very strong positive correlation (0.84) exists between density and residual sugar.
Negative Correlation:
Density and Quality: There is a notable negative correlation (-0.31) with wine quality.
Volatile Acidity and Quality: It has a moderately negative correlation (-0.19) with wine quality.
pH and Quality: the pH level is negatively correlated (-0.17) with wine quality. Wines with higher pH levels (less acidity) may lack the freshness that lower pH wines provide.
Other Insights:
Residual Sugar and Quality: residual sugar has a very weak correlation (-0.01) with wine quality, suggesting that it is not a strong indicator of quality.
Citric Acid and Quality: Citric acid shows a negative correlation (-0.19) with wine quality, suggesting that it is not a strong indicator of quality
Sulphates and Quality: there is a moderate positive correlation (0.16) between sulphates and quality, implying that sulphates may have a small positive impact on the quality.
Caveats:
This dataset, as mentioned in the introduction, is about the red variants of Portuguese "Vinho Verde" wine. The variables here and how they affect wine ‘quality’ may not necessarily translate to other types of wines.
The term Vinho Verde literally translates to ‘green wine,’ the wines from this Portuguese region aren’t actually green. Interestingly, they may even be red, like the ones in the dataset. The ‘green’ descriptor refers not to color but to the idea of youthfulness: these wines — whether red, white, or rosé — are typically meant to be enjoyed within the first few years after production, which might explain the negative correlations between quality and factors such as density or pH.


