Healthcare Data
I conduct an Exploratory Data Analysis (EDA) on a healthcare dataset and use unsupervised machine learning techniques to detect anomalies in the dataset. The objective is to detect hospitals that may abuse the resources compared to their peers of the same DRG and State.
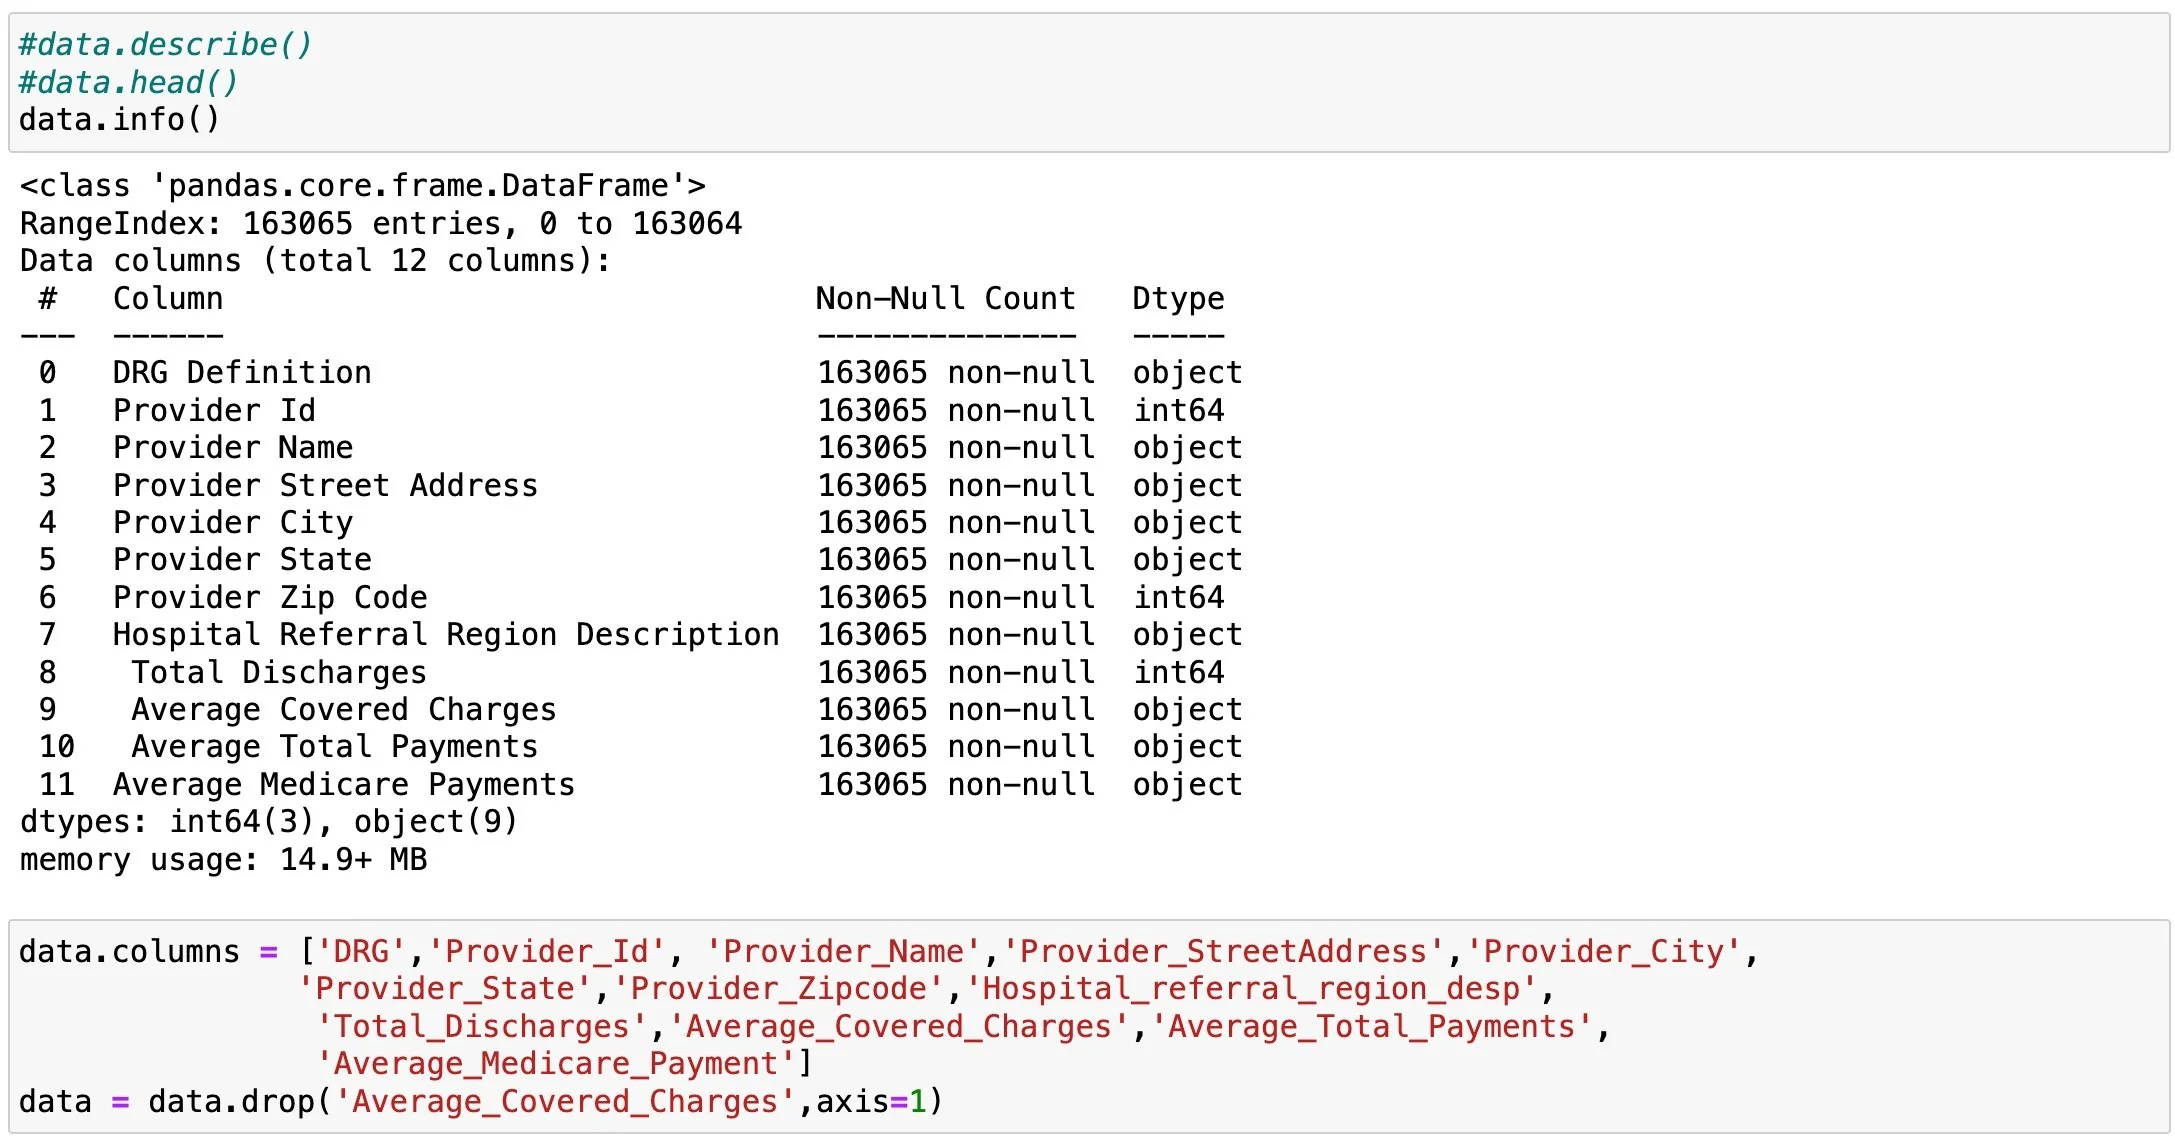
First, I import packages and data; I rename the columns for improved usability and efficiency; I also change the data type of columns with dollar ($) signs to numeric by removing the dollar sign.
EDA
Examining the data shape
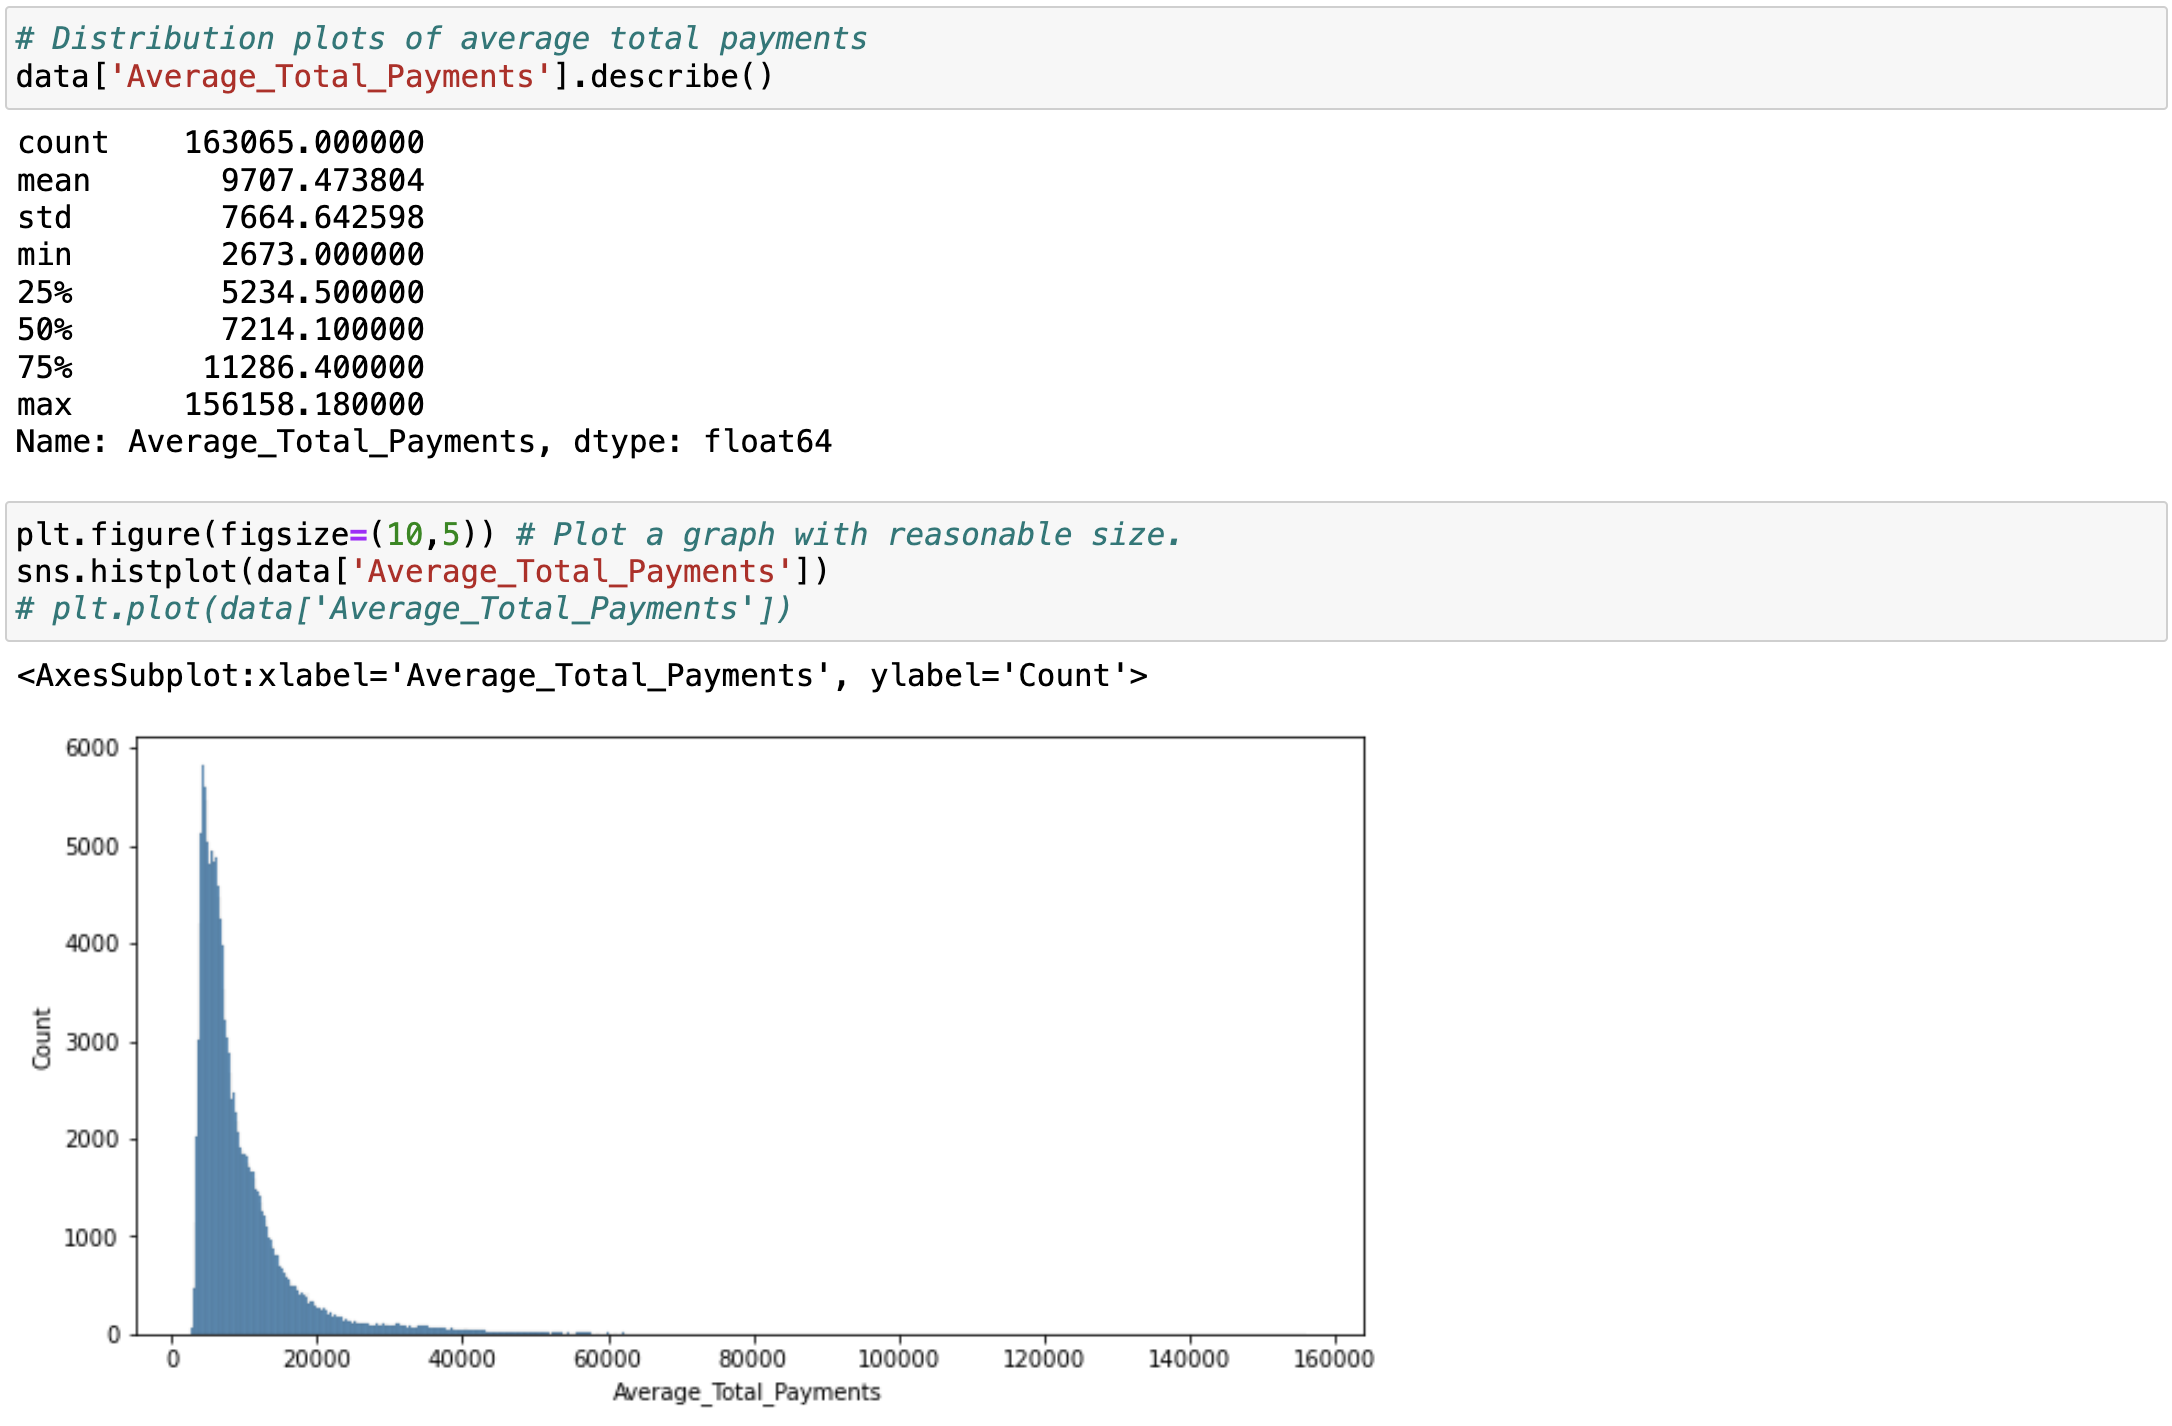
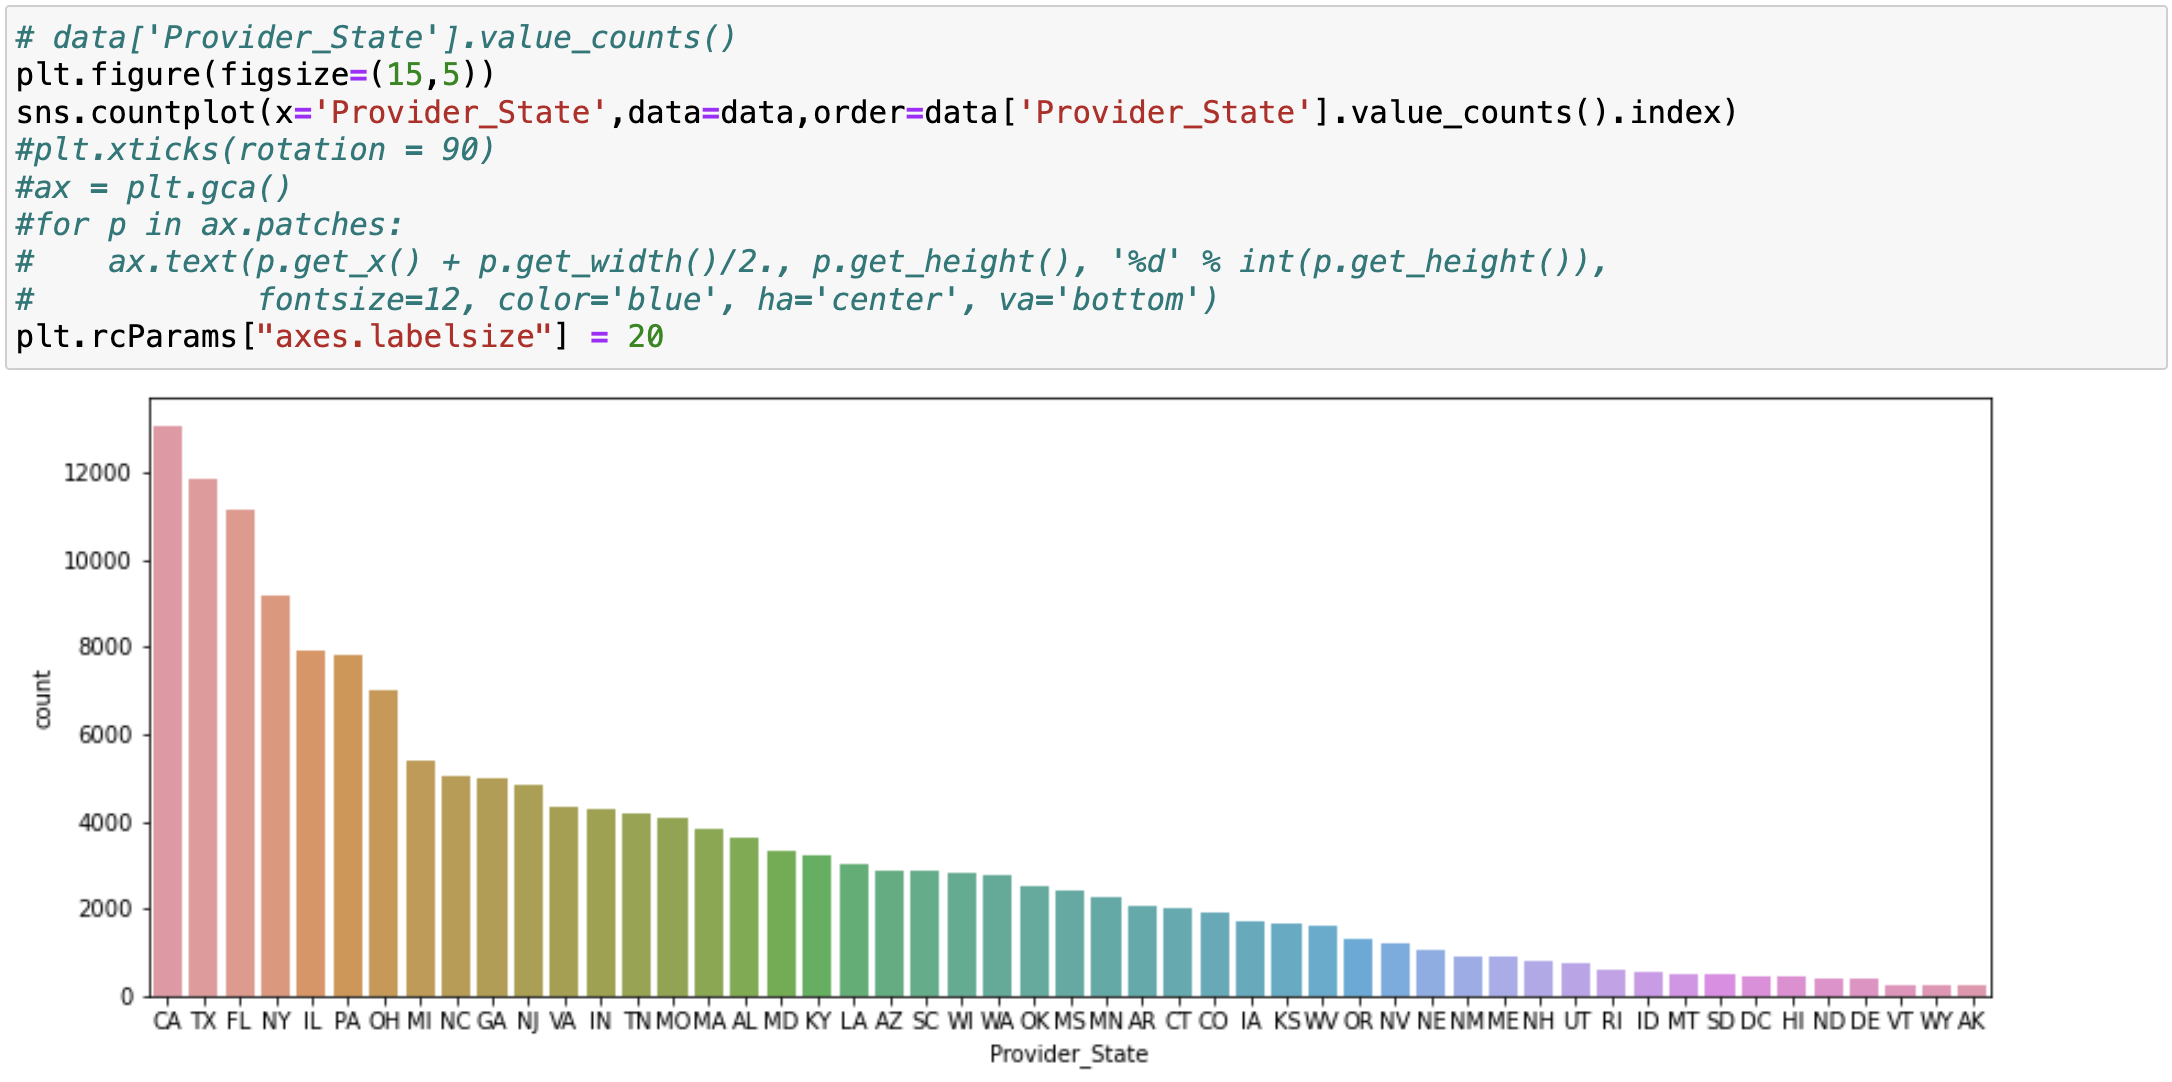
I examine the distribution of ‘Average_Total_Payments’ and also the distribution of provider states.
From the distribution statistics of average total payments, we can see that 75% of the average total payments is lower than $11,286.40, but the highest average total payment is $156,158.18.
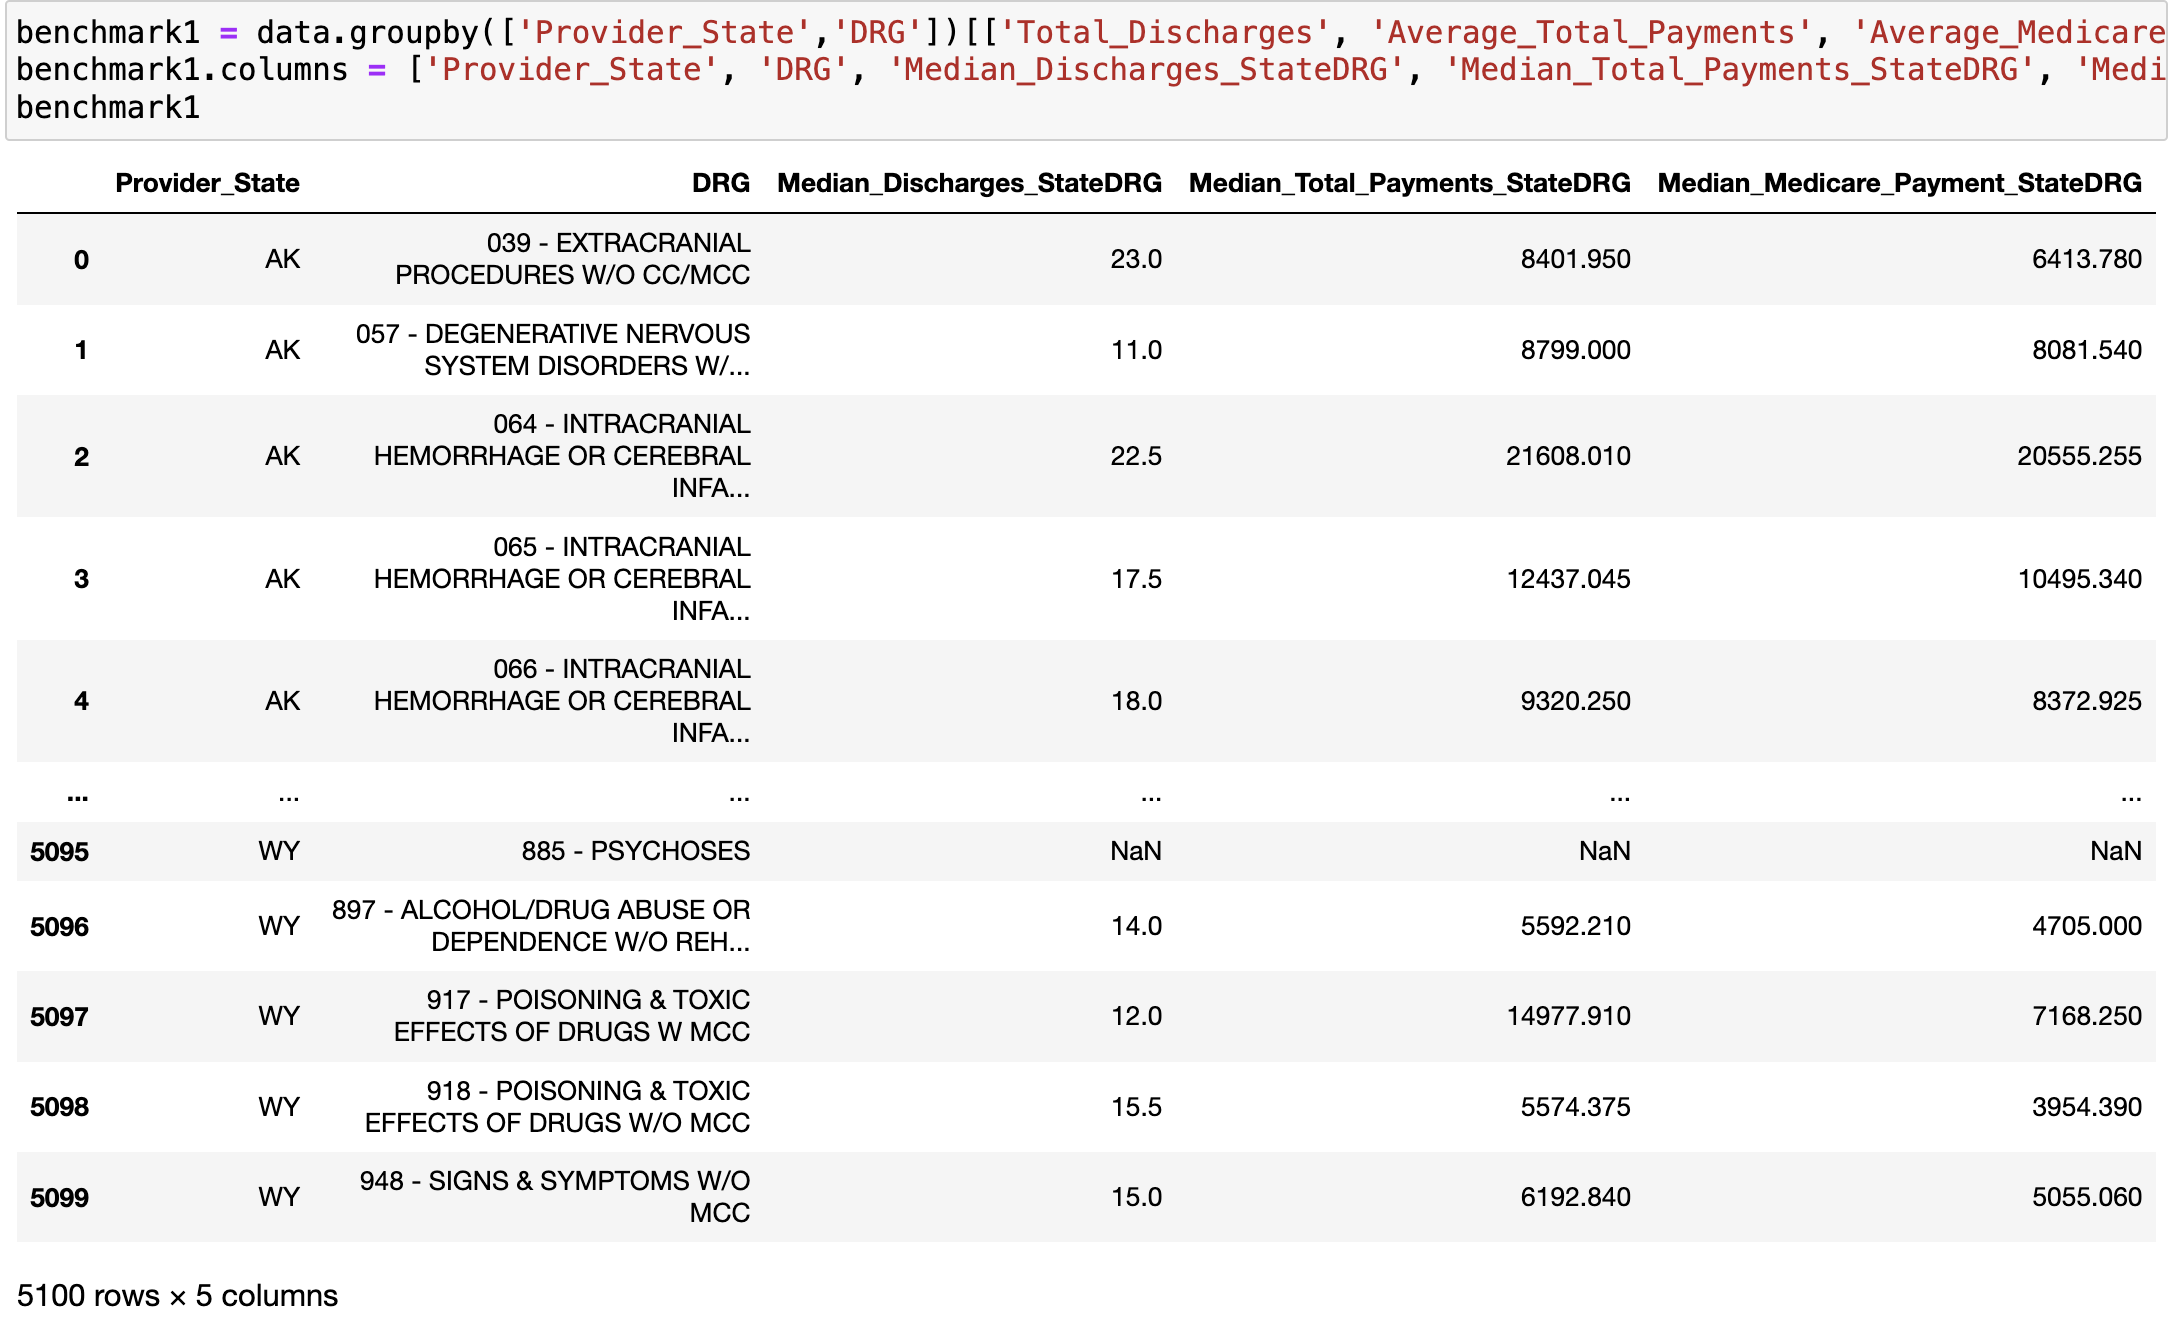
Creating the benchmark table
Here, I create a benchmark table, so that by grouping by provider state and DRG and median payments ('Total_Discharges', 'Average_Total_Payments', 'Average_Medicare_Payment')
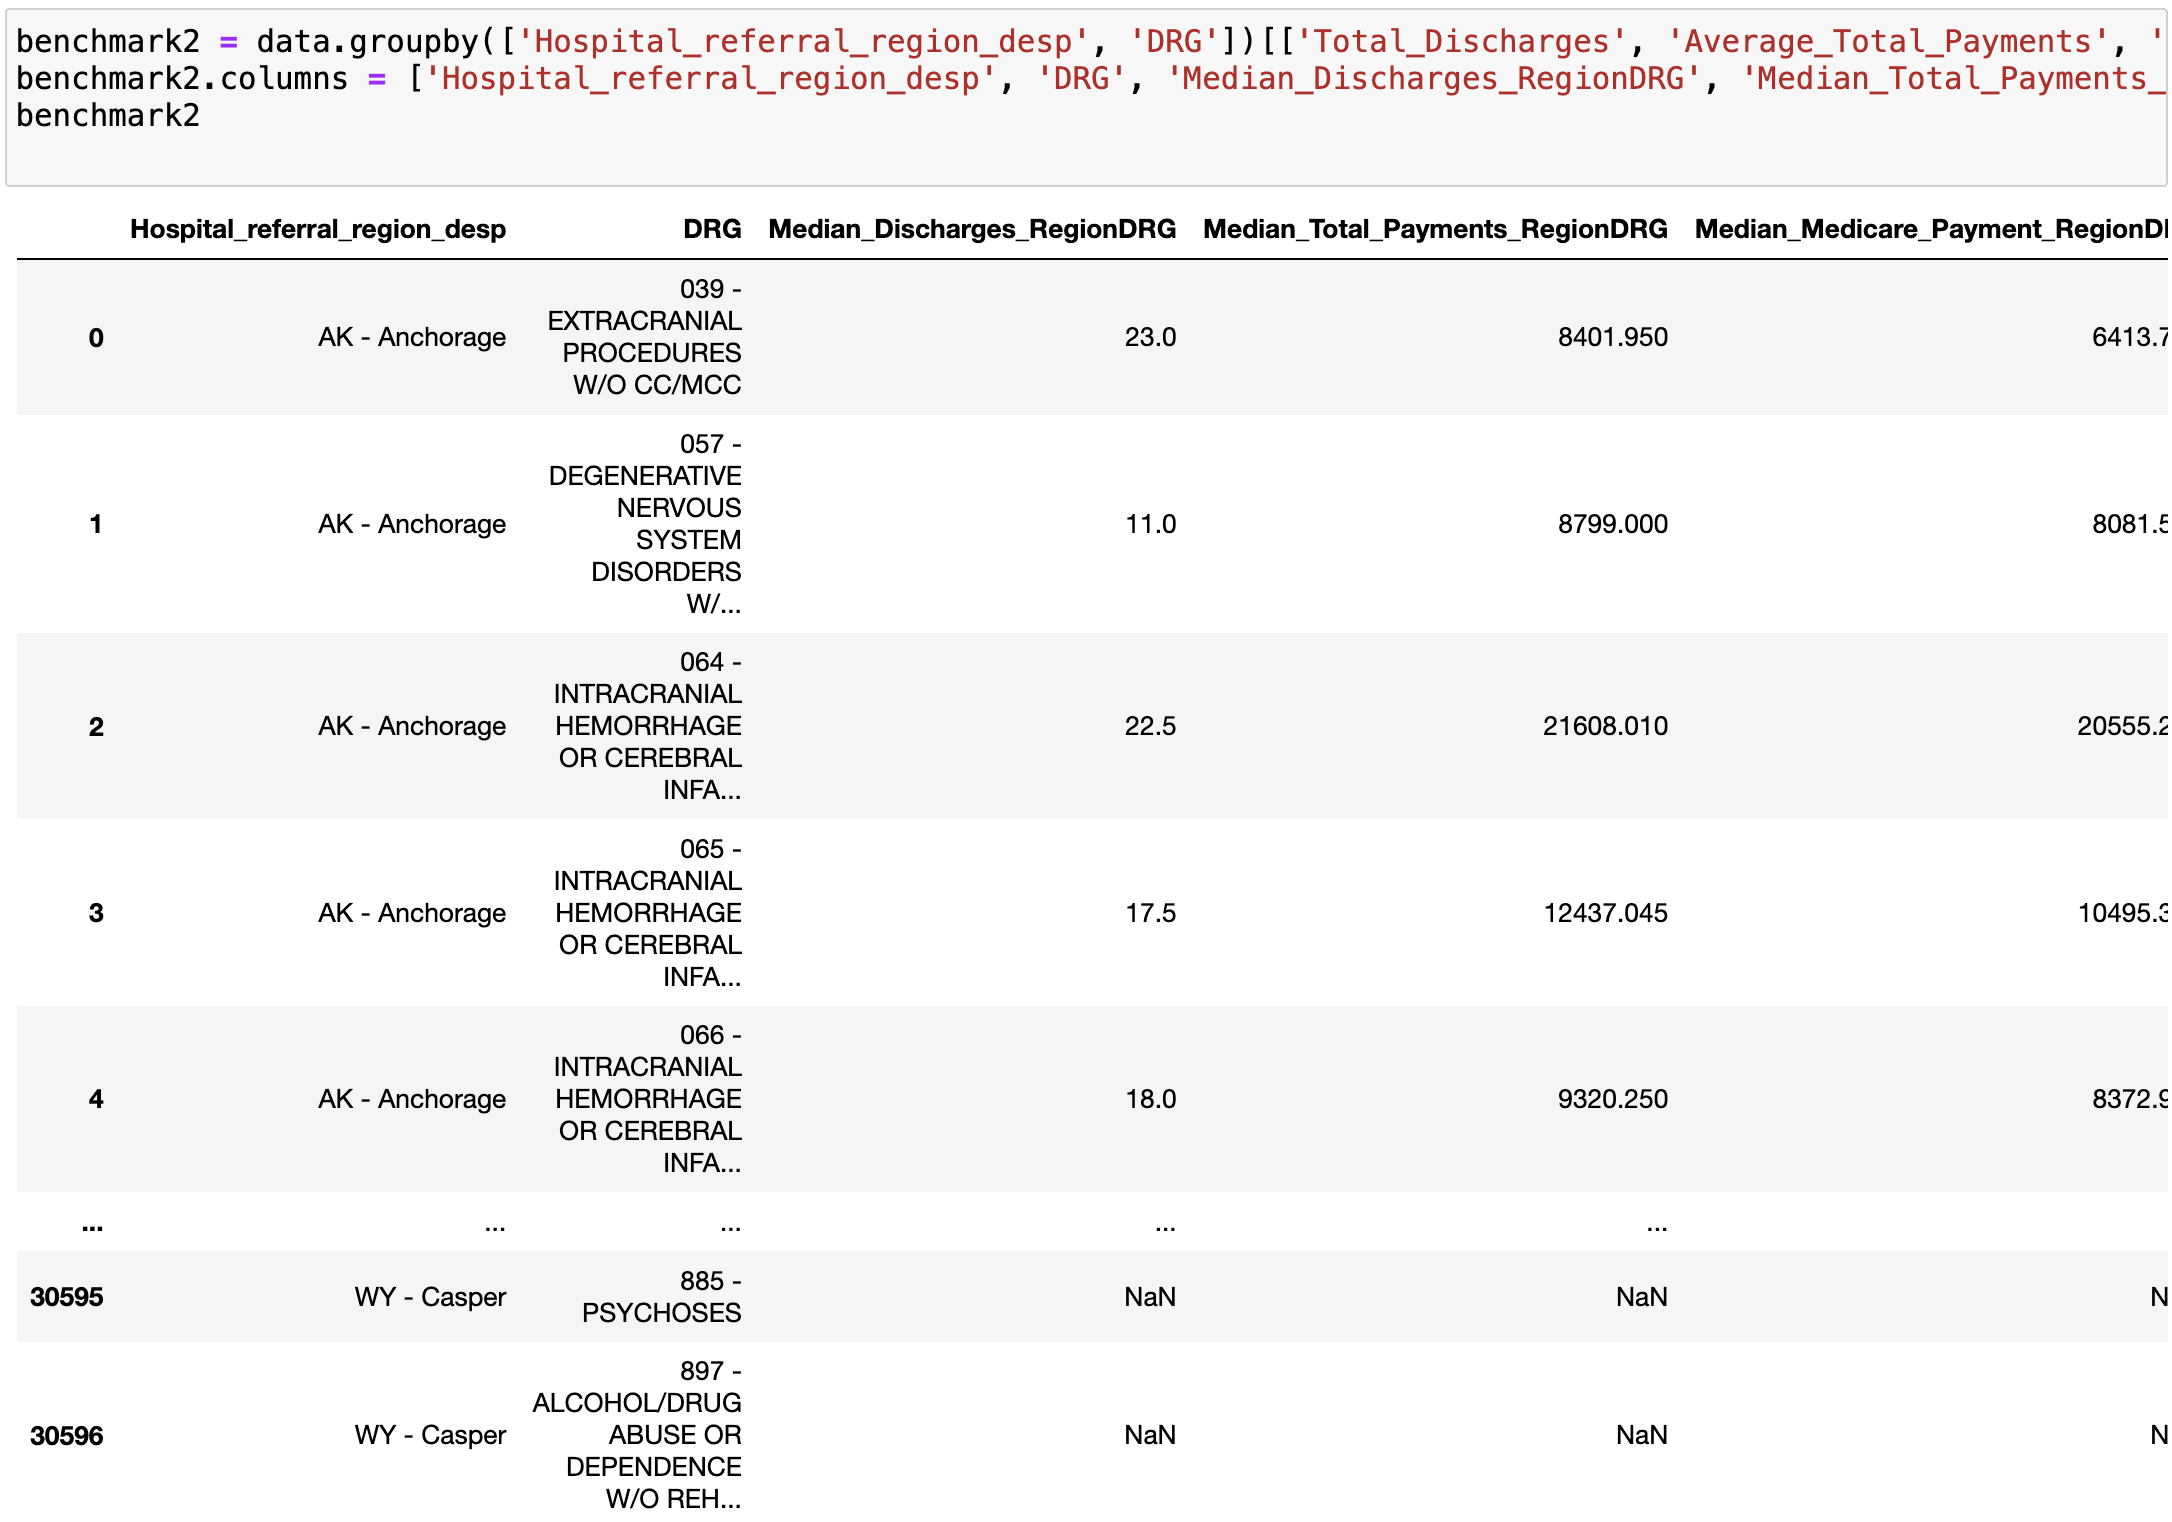
I create another benchmark table (Benchmark2), which looks at median payments by Referral Region.
The columns for benchmark2 table are 'Hospital_referral_region_desp', 'DRG', 'Median_Discharges_RegionDRG', 'Median_Total_Payments_RegionDRG', 'Median_Medicare_Payment_RegionDRG'.
Next, I merge the original data and benchmark1 and benchmark2 on ['Provider_State', 'DRG'] and ['Hospital_referral_region_desp', 'DRG'], to create df1 and df2, respectively and make a features list as below.
Principal Component Analysis
Principal Component Analysis(PCA) is a techinique used for anomaly detection in machine learning. PCA reduces the dimensionality of high-dimensional data by identifying the principal components that capture the most variance in the dataset.
the outlier score of a data point in PCA is: the sum of weighted euclidean distance between each observation to the hyperplane constructed by the selected eigenvectors
I import necessary libraries and set split the data into test and train and calculate the contamination
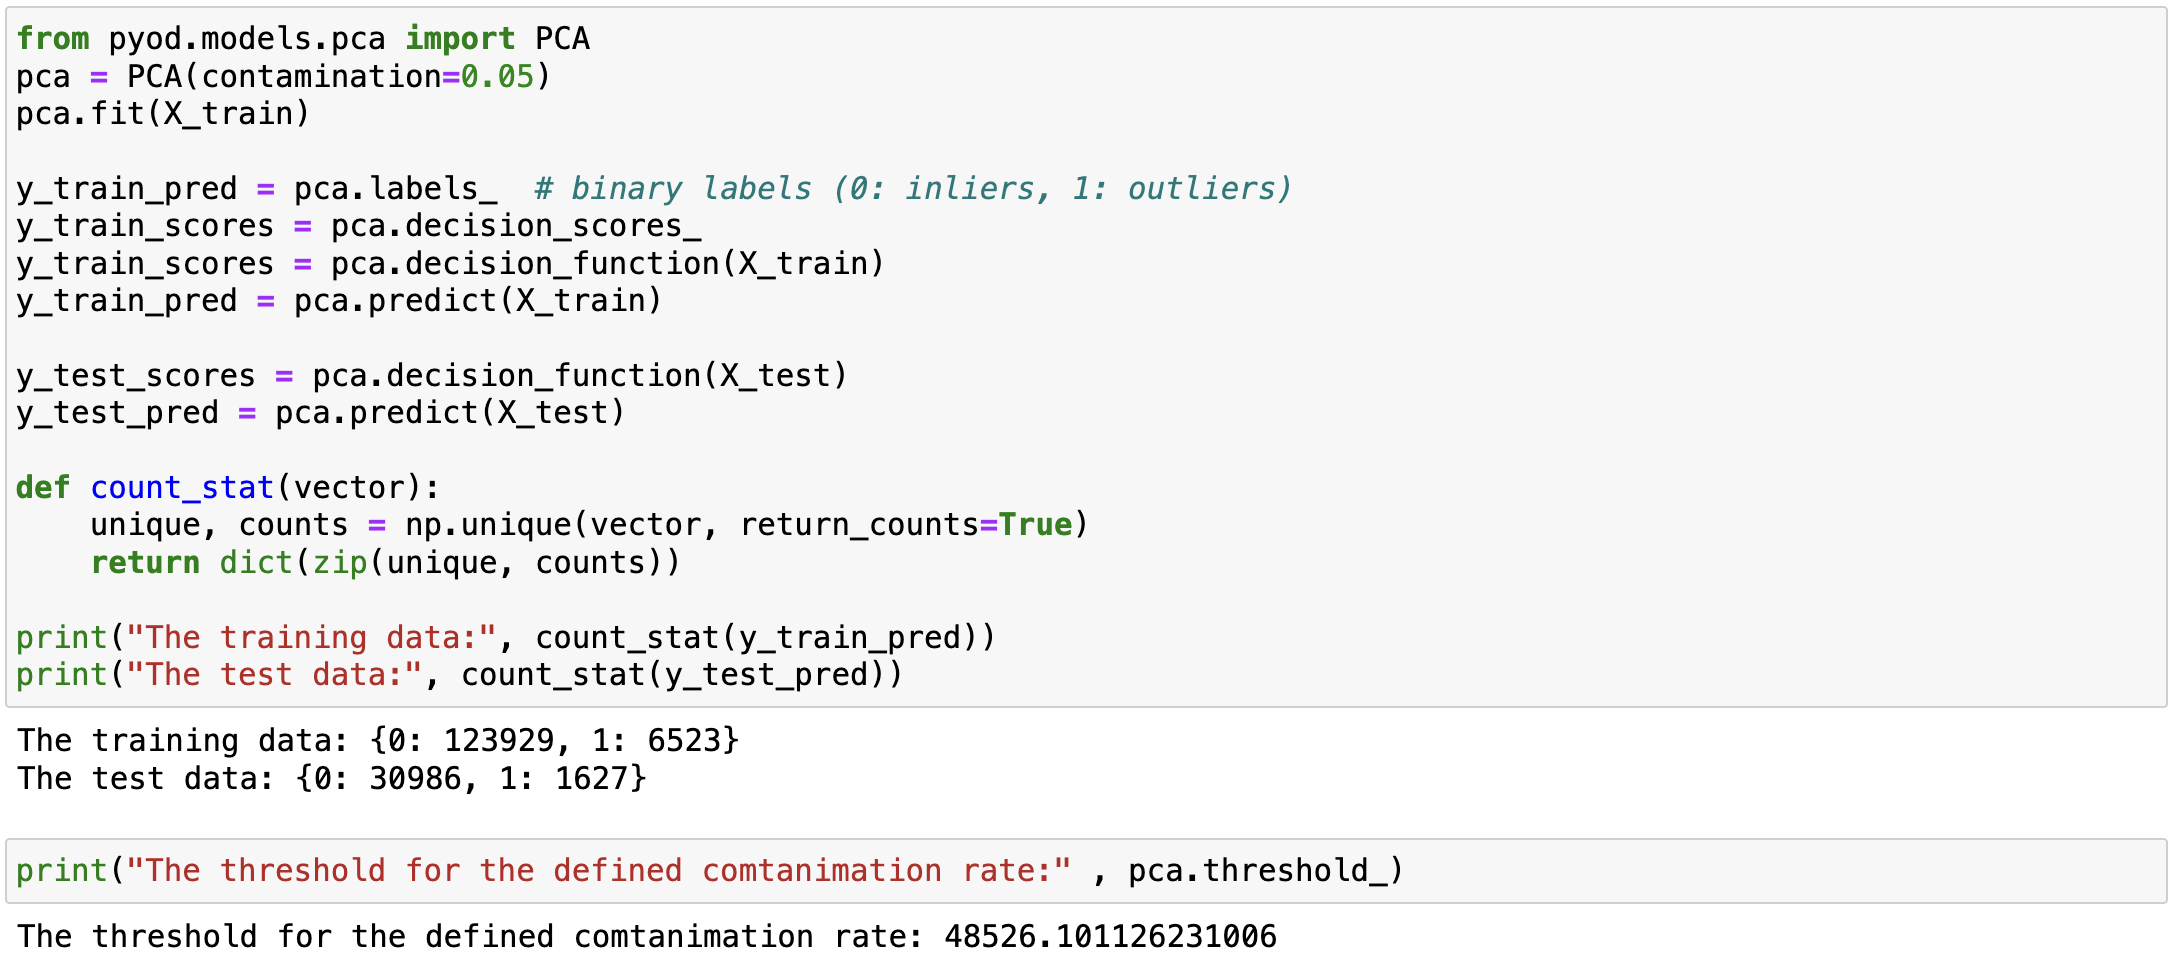
I set the contamination to 0.05, which means that 5% of the data is assumed to be outliers. Then, I fit the PCA model to the training data (X_train).
For outlier prediction, I have binary labels where 0 represents inliners and 1 represents outliers.
The pca.thresholds_ is the decision threshold that corresponds to the top 5% of the decision scores. In this case, the threshold is 48526.10, which means that points with a decision score greater than 48526,1 will be classified as outliers.
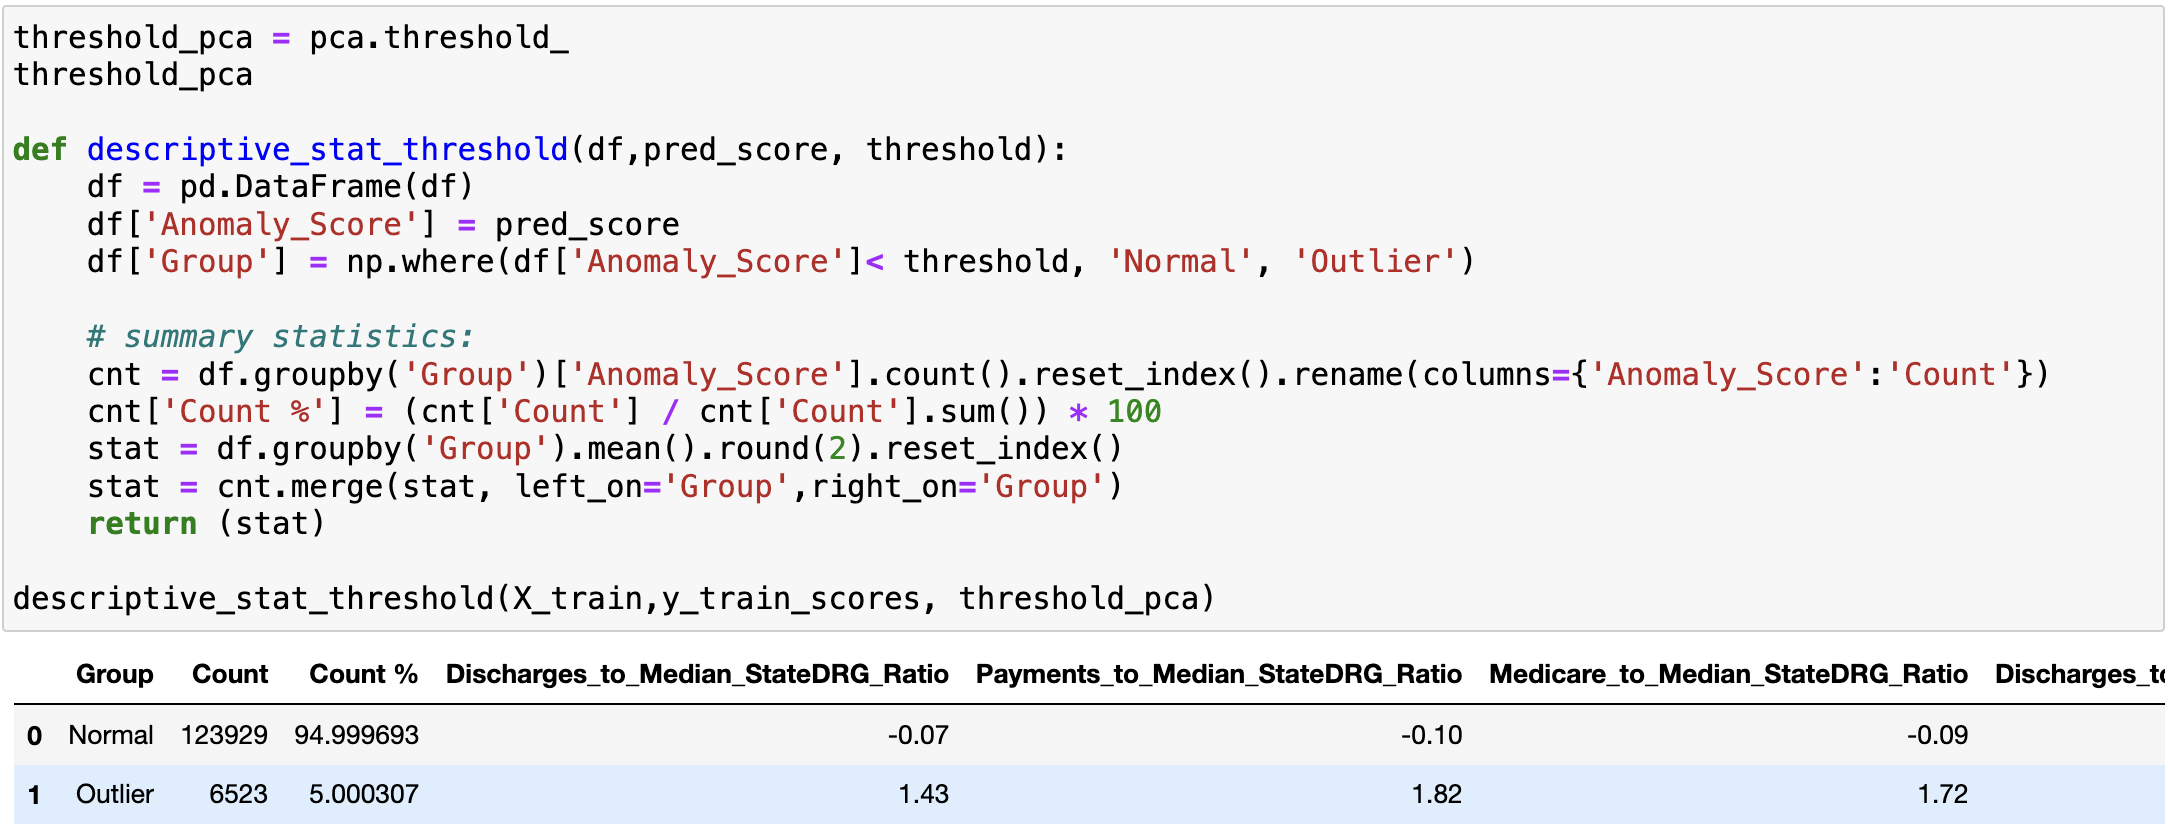
Then, I write a custom function that provides descriptive statistics for the inliners and outliners based on the threshold. The function also creates two columns ‘Anomaly_Score’ which contains the anomaly scores and ‘Group,’ which labels each point as either ‘Normal’ or ‘Outlier’ based on a point’s anomaly score.
I apply the function to the test set, and print the first 5 entries from the detected anomaly group as below:


